Your cart is currently empty!
PinBar Setup
Original website: https://indicatorvaulthq.com/pbsetup/ Original price: $99 This “Pin Bar Setup” Indicator Automatically Detects High-Probability Pin Bar Patterns For You… Then It Tells You All Of The Important ENTRY, Stop-Loss, Take Profit 1 and Take Profit 2 Levels… When a high-probability pin bar pattern appears, this “Pin Bar Setup” indicator INSTANTLY gives you an alert (pop-up, […]
Description
Original website: https://indicatorvaulthq.com/pbsetup/
Original price: $99
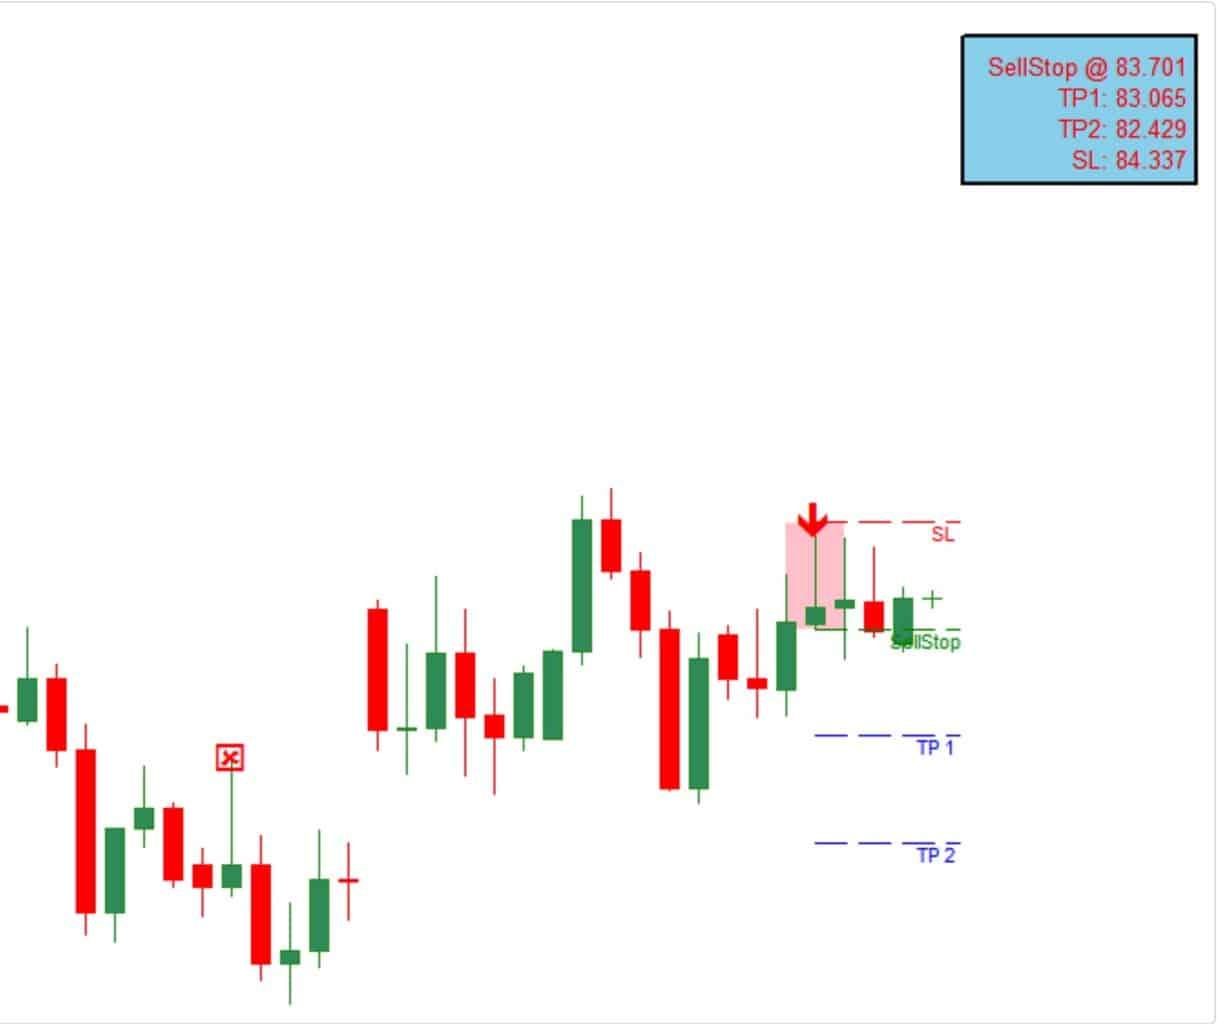
When a high-probability pin bar pattern appears, this “Pin Bar Setup” indicator INSTANTLY gives you an alert (pop-up, sound, and push alerts)… with Entry, Stop Loss, Take Profit 1, and Take Profit 2 suggestions.
Here’s an example:
Here’s why it’s important to you:
So everybody tells you that Pin Bar is one of the most accurate price patterns…
And I guess they also tell you it’s even more accurate if it occurs at key support and resistance level…
But in reality, Pin Bar doesn’t always work like it’s supposed to…
For example, here’s a Pin Bar I saw a while back:

Nicely shaped pin bar. The market is clearly in a downtrend. And this Pin Bar also happens at a key resistance level.
Everything is in my favor. Perfect setup for a short trade, isn’t it?
Watch what happens next:

Immediately after this pin bar formed, price moved up. If I entered my short trade after the pin bar showed up, the price would have triggered my stop loss shortly after.
A painful loss.
But why did this trade not work out? Am I missing something?
Here’s the problem:
Not every pin bar is a high probability setup. And not every pin bar is worth trading…
There are several factors that will increase the chance of success of a pin bar.
For example, if a pin bar occurs in a strong trend after price retraces to a support or resistance level, it’s more likely to succeed.
But that’s not enough…
Here’s what most traders miss out:
What matters the most is the structure of the pin bar itself…
What I mean is the size of the pin bar’s tail, its body, and its nose. They will tell you whether a particular pin bar is capable of signaling a winning trade.
From our statistical studies, I discover a certain STRUCTURE… a combination of certain tail, nose, and body size that makes a pin bar more likely to succeed.
And I coded this structure into the algorithm of our new Pin Bar Setup indicator.
So that this indicator could do all the hard work for you.
It automatically finds all of the high-probability pin bar patterns for you…
So you don’t have to lift a finger.
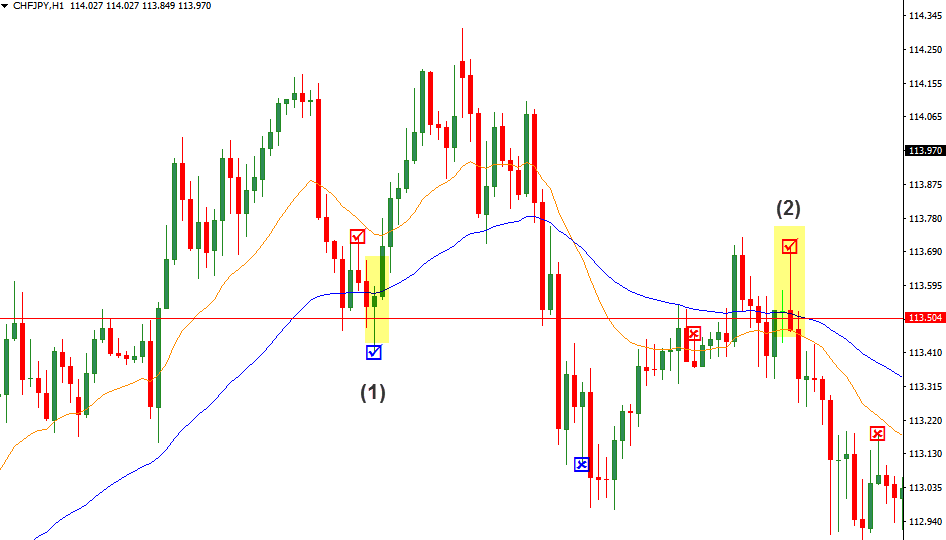
Let’s look at a few of these high-probability setups:
There are one bullish pin bar setup (labeled 1) and one bearish pin bar setup that you should pay attention to (labeled 2).
For setup (1), a bullish pin bar pattern was formed in the middle of an uptrend. The price was testing a previous support resistance zone. And the price was also hovering an important round number level: 113.500. All these factors pointed to a high-probability setup. If you had decided to take this setup, you would have gotten yourself a nice, profitable trade.
And not long after that, a bearish pattern was formed (labeled 2). The market at the moment was in a downtrend. The price was testing a previous support resistance zone. And the price was also hovering an important round number level: 113.500. All these factors pointed to a high-probability setup.
For each of these 2 Pin Bar setups, both Take Profit levels are hit, leaving us with a nice profit.
So… what could we learn from this example?
Two things:
First, we learn that we should trade in the direction of the prevailing trend.
Two, we learn that we should combine pin bar patterns with other old-school time-tested trading concepts to increase our chance of success. I’m talking about concepts like: support and resistance, round-number levels, etc…
But anyway, automatically identifying high-probability pin bar setups is just the 1st thing this “Pin Bar Setup” indicator does for you…
The 2nd thing this indicator does for you is:
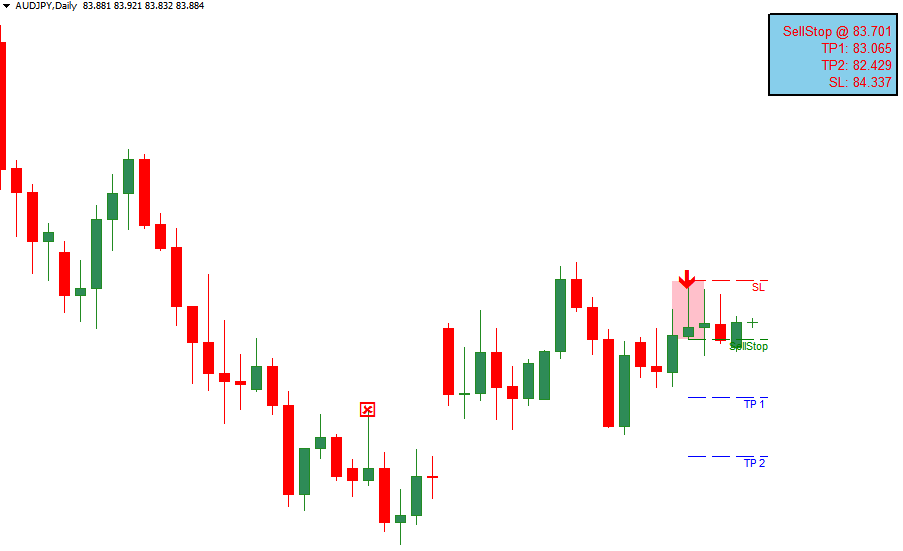
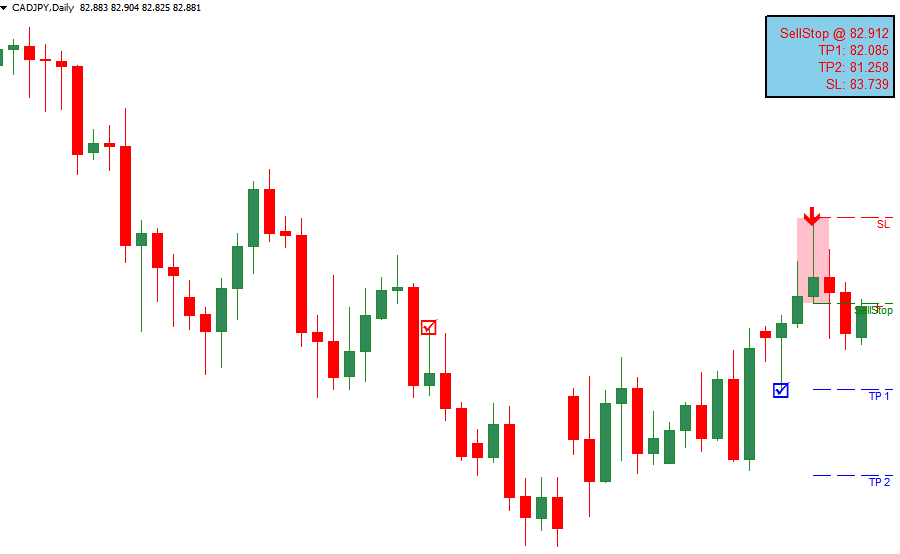
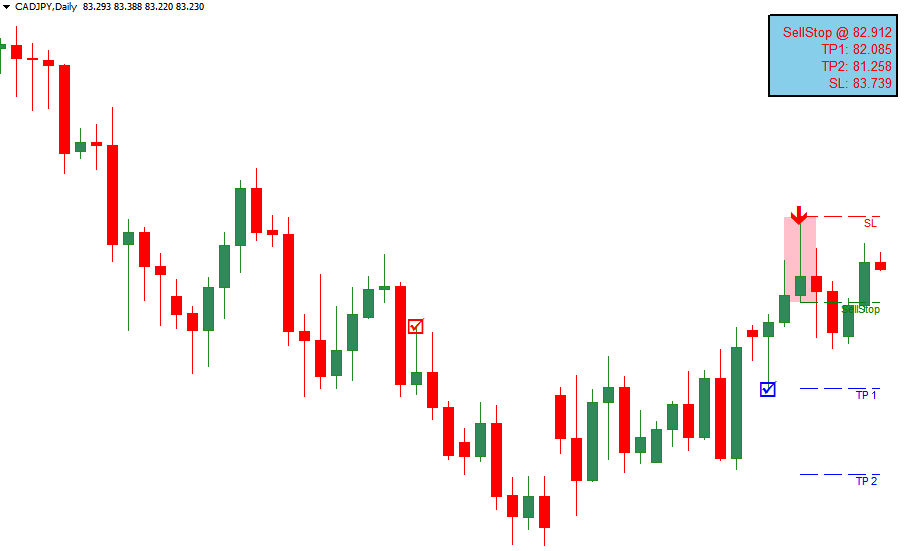
For each trade setup, the indicator also tells you the optimal Entry, Stop Loss, Take Profit 1, and Take Profit 2 levels. And it automatically plots these levels on your chart, so you can see them very clearly…
Take a look at this photo to see what I mean:
See how clear everything is: the Entry, Stop Loss, Take Profit 1, and Take Profit 2 levels…
And on top of all that, maybe the most interesting feature of this “Pin Bar Setup” indicator is…
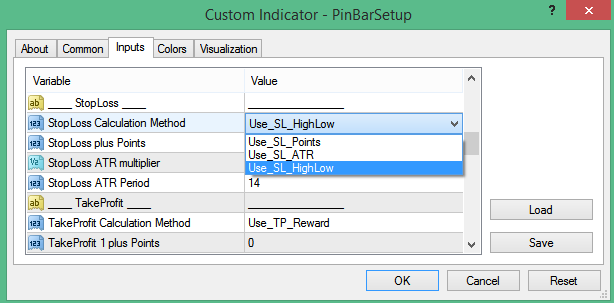
You have total FREEDOM and FLEXIBILITY: You can choose which method you’d like to use to calculate these stop loss and take profit levels…
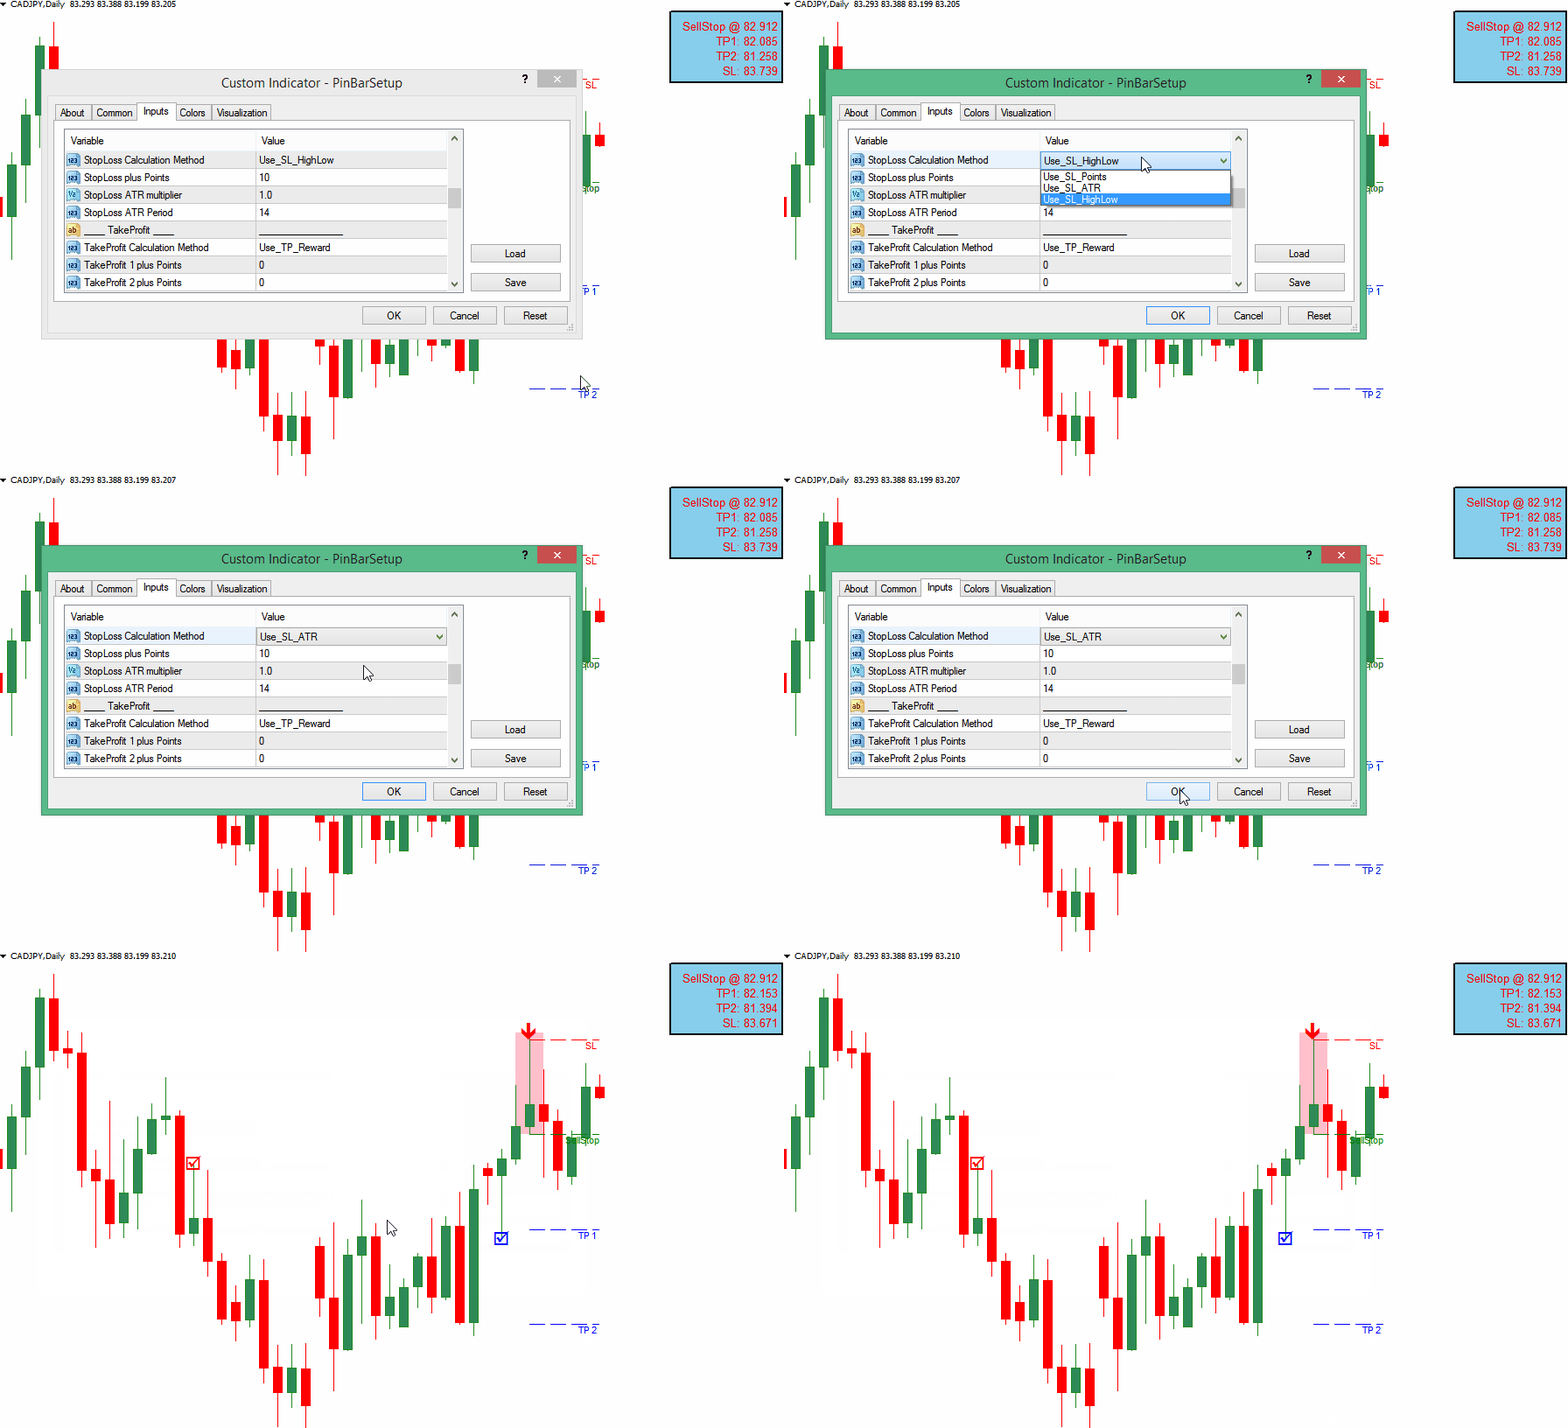
You can choose to calculate your stop loss based on: the pattern’s high and low price… OR… number of pips… OR… the pair’s volatility (using Average True Range).
And you can choose to calculate your take profit based on: reward/risk ratio.. OR… number of pips… OR… the pair’s volatility (using Average True Range).
Here’s a tip: For me personally, I’d use Reward/Risk ratio as my method for calculating take-profit levels. That way, I could be sure that my Reward/Risk ratio would be at least 2:1. And as a consequence of that, I’d only need to win 50% of the trades to be profitable.
By the way, here’s a screenshot of me changing the method of calculating stop loss. So you can see what I mean:
By the way, it’s very very easy to trade with Pin Bar Setup indicator because…
The indicator gives you all kinds of alerts: Pop-up, Sound, Email, and Push Notifications as soon as a setup appears…
Plus… you’re in total control. For example, you can change the color of any text, entry, stop loss & take profit.
And… you can even change how the indicator defines a pin bar pattern. For example, if you’d like to be strict and want to identify only the highest-quality patterns, you could easily do so.
